How to present data in tables and figures
Contents5
You've collected and analyzed your data, but now you have to present it. This is where most of the value is either won or lost. An estimated 90% of data presentations fail to drive any real decisions, often because the information isn't presented in a way the audience can act on. To make your work count, focus on simplicity. Choose visuals that match your message, like bar charts for comparisons and line charts for trends. Avoid cluttered pie charts and confusing color schemes. Most important, make your numbers relatable by translating percentages like "14%" into human-scale ideas like "1 in every 7 people."
How do you present data effectively to an audience?
Your data only becomes powerful when you give it context and present it clearly to the right people. About 90% of data presentations fail to drive any action, which shows a huge gap between having data and actually using it. The key is to simplify and focus on the core message.
Remember that data specialists report spending up to 80% of their time just preparing data. That's a massive investment. Your presentation is the final step where that work pays off—or doesn't. Don't just show your audience a spreadsheet.
Think about your audience first. Who are they? What do they care about most? And what do you want them to do after seeing your data? The answers should shape every chart you build and every point you make. Your goal isn't to show how much work you did. It's to give them the one or two key insights that will help them make a better decision. Keep it simple and connect it back to what matters to them.
Before you even open your presentation software, write down the single most important message you want your audience to remember. Every chart and table you create should support that one message.
What are the most common mistakes in data visualization?
One of the biggest mistakes is misusing color. Using a rainbow of colors might seem cheerful, but it often just confuses the audience and can lead to misinterpreting results. Another classic error is overusing pie charts, especially when they have more than five slices. They become almost impossible to read with any accuracy.
Let's talk about axes. When you use a bar chart, the Y-axis must start at zero. If it doesn't, you create a misleading picture of your data's scale, making a small difference look like a giant gap. These aren't minor stylistic points. They are fundamental to presenting data honestly. According to best practices from data visualization experts, getting these basics right is the foundation of any good chart.
Pie charts with more than five segments are incredibly difficult for the human eye to compare. Our brains aren't good at judging angles and area, so we can't easily tell if one slice is bigger than another. Use a simple bar chart instead.
Here’s a quick comparison of common bad habits and their better alternatives:
| Bad Practice | Good Practice |
|---|---|
| Pie chart with 10 slices | A simple bar chart ordering the 10 categories |
| A different color for every bar | A neutral color for all bars, with one highlight color |
| Bar chart Y-axis starting at 50 | Bar chart Y-axis starting at 0 |
| A dense, complex data table | A clean line graph showing the key trend over time |
Avoiding these simple mistakes will instantly make your charts clearer and more trustworthy.
How do you turn data into a persuasive story?
The main point of data visualization is to make complex information understandable and, most of all, actionable. You're not just showing numbers; you're guiding your audience to a conclusion. You do this by building a narrative around your data and framing it in a way that connects on a human level.
One of the best ways to do this is by translating abstract numbers into relatable scales. For example, instead of saying "customer churn increased by 14%," try "for every 7 customers we had last year, one has now left." As explained in this guide on data presentation, this simple switch connects the data to a scale people can actually picture. It makes the information stick.
Another strong technique is to connect the data directly to a recommended action and its financial impact. Don't just state a problem; propose a solution backed by your numbers.
Instead of saying, "Employee turnover is up 15% this quarter," frame it as a clear business case: "Our exit interviews show poor leadership is costing us $1.2 million a year in turnover. By investing $200,000 in management training, we can directly address this and save the company money."
This approach transforms you from a data reporter into a trusted advisor. You're not just presenting facts; you're providing a clear path forward.
How do you choose the right visual for your data?
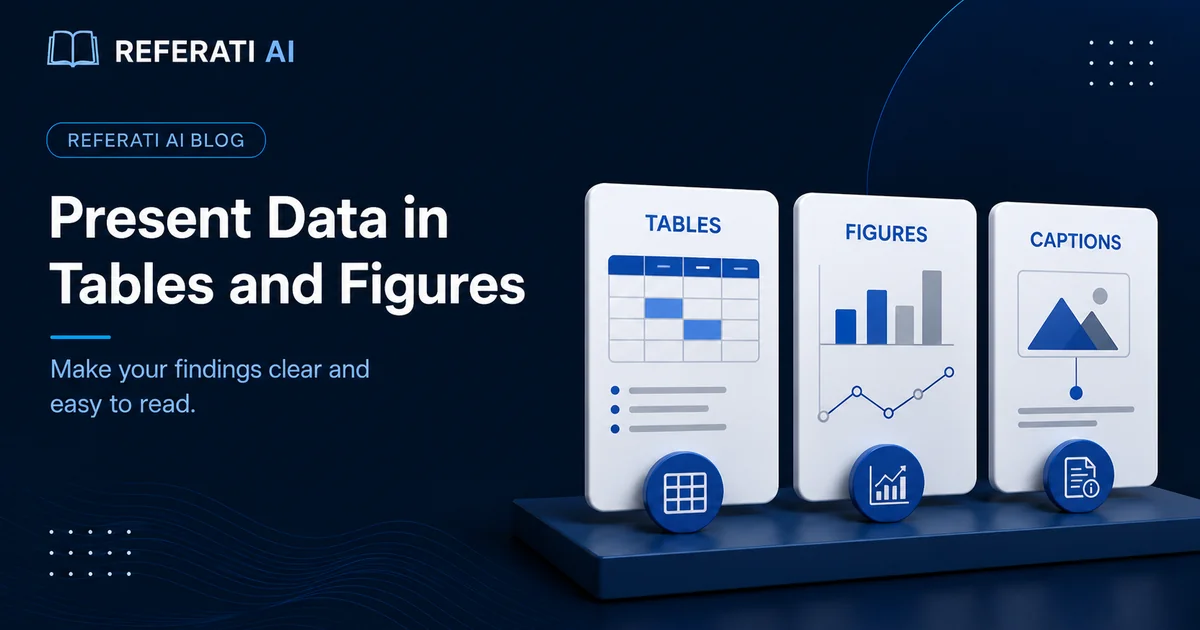
Good data visualization always starts with picking the right chart or graph for your message. Your choice of format can either clarify your point or completely hide it. The format isn't just decoration; it's part of the argument you're making and is critical for clear communication.
For example, imagine you're presenting an investment portfolio. You could use a pie chart to show the general allocation—say, 50% stocks, 30% bonds, and 20% real estate. This works fine for a quick overview of the parts of a whole. But what if you want to compare the exact dollar performance of each asset class? A bar chart would be much better. It allows for a precise side-by-side comparison that a pie chart just can't offer. As many data visualization guides point out, using a pie chart with more than a few slices makes it nearly impossible for anyone to compare the segments accurately.
The right choice always depends on the story you're trying to tell.
- Use a line chart to show a trend over time.
- Use a bar chart to compare quantities across different categories.
- Use a scatter plot to show the relationship between two different variables.
- Use a table when your audience needs to see precise values or look up specific numbers.
Don't just rely on your software's default suggestion. Think critically about what you want your audience to see, and choose the format that highlights that specific insight.
Frequently Asked Questions
How do I choose the right chart type for my data?
Think about your main message. Use a line chart to show changes over time, a bar chart to compare different categories, a scatter plot to show relationships between variables, and a pie chart only for showing simple parts of a whole (with five or fewer categories).
Why should I avoid using pie charts in many cases?
Our brains are not good at comparing the sizes of angles and areas, which is how we read pie charts. If you have more than a few slices, it becomes very difficult to see which is biggest. A bar chart is almost always a clearer and more accurate alternative for comparisons.
How can I use color effectively in data visualizations?
Less is more. Use a neutral color like gray for your main data points, and then use one or two bright, contrasting colors to highlight the most important information. This approach guides your audience's attention exactly where you want it. Also avoid using colors that are hard for colorblind individuals to distinguish.
How can I make my data presentation hold my audience's attention?
Turn your data into a story. Start with a hook, build context, present your key finding, and end with a clear call to action. Frame your numbers in human terms, like "1 in 7 people" instead of "14%," to make the information more memorable and relatable.
What is the primary goal of data visualization?
The main goal is to make complex data understandable, insightful, and actionable. A good visualization doesn't just show numbers; it reveals patterns, trends, and outliers in a way that helps people make informed decisions. It is a tool for communication, not just decoration.
How many metrics should I show on a single dashboard?
Try to limit a single dashboard or slide to between 5 and 9 key metrics. Any more than that, and you risk overwhelming your audience with too much information, a problem known as cognitive overload. Focus only on the numbers that are most critical to the decision at hand.
Still wrestling with how to frame your research and present your findings? Try referati.ai: an AI built for academic writing.